Cronaca
Sostituzioni
Classifica
Formazioni
Statistiche
Stat calciatori
- J. Morris 2
- S. Brunell 1
- D. Bouanga 2
- J. Ragen 1
- T. Tillman 3
- P. Rothrock 2
- T. Tillman 3
- M. Choinière 3
- M. Choinière 3
- K. Kossa-Rienzi 3
- A. Thomas 2
- E. Segura 74
- A. Long 74
- A. Long 71
- R. Porteous 64
Serie in corso
Ultimi confronti
-
Ramy Touchan arbitro principale4.70.3Media di cartellini a partita su 3 partite arbitrate
- Rhett Hammil arbitro VAR
- Elijio Arreguin quarto uomo
- Tyler Wyrostek assistente
- Christopher Ramsey Cortez-Elliott assistente
- Lukasz Szpala arbitro assistente VAR
- Anno di costruzione: 2018
- Superficie: erba
- Capacità: 22937
- Affluenza media: 21408
- Affluenza massima: 22937
- Affluenza minima: 4900
- % di affluenza: 93
Risultato della partita LAFC Sounders
- Data 25 maggio 2026 03:15
- Competizione MLS
- Stagione 2026
- Fase Regular Season
- Affluenza per la partita 22146
- Codice LAF-SEA
- Zona Stati-uniti
- Squadra di casa Los Angeles
- Squadra in trasferta Seattle Sounders
Qual è il risultato della partita LAFC Sounders ?
Los Angeles ha vinto la partita sul punteggio di 1-0
Quali sono le formazioni ufficiali di LAFC Sounders ?
Los Angeles : Allenata da M. Dos Santos, la squadra inizia in 4-3-3 : T. Hasal, E. Segura, A. Long, R. Porteous, R. Hollingshead, T. Tillman, M. Choinière, M. Delgado, D. Bouanga, Son Heung-Min (C), D. Martínez
Seattle Sounders : Dal canto suo, la squadra allenata da B. Schmetzer, inizia con 4-4-2 : A. Thomas (C), N. Tolo, J. Ragen, Kim Kee-Hee, K. Kossa-Rienzi, P. Rothrock, C. Roldan, H. Dotson, J. Ferreira, A. Rusnák, J. Morris
Chi è l'arbitro di LAFC Sounders ?
Ramy Touchan arbitra questo incontro
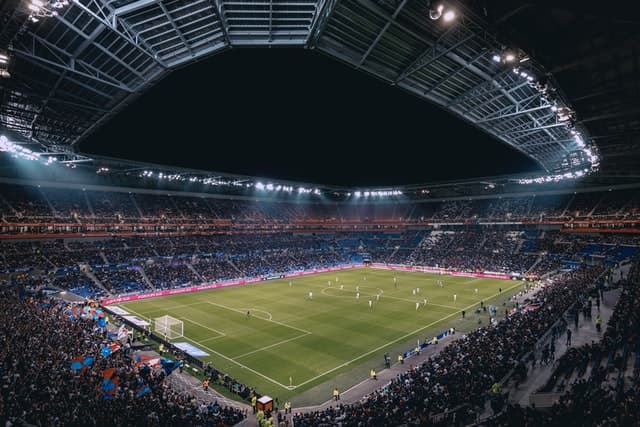
Dove ha luogo la partita LAFC Sounders ?
La partita è allo stadio BMO Stadium a Los Angeles, California
Data e ora della partita LAFC Sounders ?
Partita in diretta su Calcio Risultati il 25 maggio 2026, calcio d'inizio alle 03:15
-
-
12
T. Hasal
-
4
E. Segura
-
33
A. Long
-
5
R. Porteous
-
24
R. Hollingshead
-
11
T. Tillman
-
66
M. Choinière
-
8
M. Delgado
-
99
D. Bouanga
-
7
(C)
Son Heung-Min
-
30
D. Martínez
-
12
T. Hasal
-
-
26
(C)
A. Thomas
-
5
N. Tolo
-
25
J. Ragen
-
20
Kim Kee-Hee
-
85
K. Kossa-Rienzi
-
14
P. Rothrock
-
7
C. Roldan
-
31
H. Dotson
-
9
J. Ferreira
-
11
A. Rusnák
-
13
J. Morris
-
26
(C)
A. Thomas
-
-
 M. Dos Santos Allenatore
-
 T. Boyd #19 - Attaccante79'
 -
C. Carter
#31
- Portiere
-
N. Tafari #91 - Difensore83'
-
A. Smoliakov #29 - Difensore90+2'
-
 S. Eustaquio #46 - Centrocampista79'
 -
J. Ebobisse
#17
- Attaccante
-
A. Boudri
#65
- Centrocampista
-
R. Raposo
#21
- Centrocampista
-
N. Ordaz
#27
- Attaccante
-
-
-
B. Schmetzer Allenatore
-
S. Brunell #37 - Centrocampista63'
-
P. Kingston #45 - Centrocampista90'
-
O. De Rosario #95 - Attaccante90'
-
 S. Frei
#24
- Portiere
S. Frei
#24
- Portiere
-
S. Gomez
#90
- Centrocampista
-
C. Baker
#33
- Difensore
-
D. Musovski #19 - Attaccante69'
-
A. Roldan
#16
- Difensore
-
A. Lopez #35 - Difensore63'
-
- S. Brunell 50% (1/2)
- T. Tillman 3
- P. Rothrock 2
- D. Bouanga 2
- Son Heung-Min 2
- A. Rusnák 0% (0/2)
- M. Choinière 0% (0/2)
- D. Martínez 0% (0/2)
- Son Heung-Min 29% (2/7)
- R. Hollingshead 95% (41/43)
- C. Roldan 94% (95/101)
- N. Tolo 94% (44/47)
- T. Tillman 93% (43/46)
| # | Squadra | Pnt | G | V | P | S | GF | GS | DIFF | |
|---|---|---|---|---|---|---|---|---|---|---|
| 1 |
|
32 | 14 | 10 | 2 | 2 | 34 | 12 | 22 | |
| 2 |
|
32 | 15 | 10 | 2 | 3 | 34 | 15 | 19 | |
| 3 |
|
26 | 14 | 8 | 2 | 4 | 26 | 19 | 7 | |
| 4 |
|
25 | 15 | 7 | 4 | 4 | 30 | 22 | 8 | |
| 5 |
|
24 | 15 | 7 | 3 | 5 | 24 | 17 | 7 | |
| 6 |
|
24 | 13 | 7 | 3 | 3 | 17 | 11 | 6 | |
| 7 |
|
22 | 14 | 7 | 1 | 6 | 19 | 23 | -4 | |
| 8 |
|
22 | 15 | 6 | 4 | 5 | 18 | 22 | -4 | |
| 9 |
|
20 | 15 | 5 | 5 | 5 | 22 | 22 | 0 | |
| 10 |
|
17 | 15 | 4 | 5 | 6 | 30 | 27 | 3 | |
| 11 |
|
16 | 15 | 5 | 1 | 9 | 25 | 24 | 1 | |
| 12 |
|
16 | 14 | 4 | 4 | 6 | 16 | 20 | -4 | |
| 13 |
|
14 | 14 | 4 | 2 | 8 | 22 | 28 | -6 | |
| 14 |
|
14 | 15 | 3 | 5 | 7 | 19 | 31 | -12 | |
| 15 |
|
11 | 14 | 3 | 2 | 9 | 14 | 36 | -22 |
| # | Squadra | Pnt | G | V | P | S | GF | GS | DIFF |
|---|---|---|---|---|---|---|---|---|---|
| 1 |
|
21 | 8 | 7 | 0 | 1 | 21 | 4 | 17 |
| 2 |
|
21 | 8 | 7 | 0 | 1 | 18 | 8 | 10 |
| 3 |
|
16 | 8 | 5 | 1 | 2 | 15 | 8 | 7 |
| 4 |
|
15 | 7 | 5 | 0 | 2 | 8 | 6 | 2 |
| 5 |
|
13 | 7 | 4 | 1 | 2 | 16 | 6 | 10 |
| 6 |
|
13 | 6 | 4 | 1 | 1 | 12 | 7 | 5 |
| 7 |
|
13 | 9 | 3 | 4 | 2 | 18 | 16 | 2 |
| 8 |
|
12 | 9 | 3 | 3 | 3 | 23 | 15 | 8 |
| 9 |
|
11 | 7 | 3 | 2 | 2 | 9 | 6 | 3 |
| 10 |
|
10 | 6 | 3 | 1 | 2 | 11 | 7 | 4 |
| 11 |
|
10 | 6 | 3 | 1 | 2 | 14 | 11 | 3 |
| 12 |
|
9 | 6 | 3 | 0 | 3 | 15 | 9 | 6 |
| 13 |
|
9 | 7 | 2 | 3 | 2 | 10 | 8 | 2 |
| 14 |
|
9 | 7 | 2 | 3 | 2 | 6 | 5 | 1 |
| 15 |
|
5 | 7 | 1 | 2 | 4 | 9 | 14 | -5 |
| # | Squadra | Pnt | G | V | P | S | GF | GS | DIFF |
|---|---|---|---|---|---|---|---|---|---|
| 1 |
|
19 | 8 | 6 | 1 | 1 | 18 | 9 | 9 |
| 2 |
|
13 | 8 | 4 | 1 | 3 | 12 | 17 | -5 |
| 3 |
|
12 | 6 | 4 | 0 | 2 | 12 | 6 | 6 |
| 4 |
|
11 | 6 | 3 | 2 | 1 | 13 | 8 | 5 |
| 5 |
|
11 | 7 | 3 | 2 | 2 | 5 | 4 | 1 |
| 6 |
|
11 | 8 | 3 | 2 | 3 | 12 | 14 | -2 |
| 7 |
|
8 | 7 | 2 | 2 | 3 | 9 | 9 | 0 |
| 8 |
|
7 | 9 | 2 | 1 | 6 | 10 | 15 | -5 |
| 9 |
|
7 | 7 | 2 | 1 | 4 | 11 | 17 | -6 |
| 10 |
|
6 | 7 | 2 | 0 | 5 | 5 | 22 | -17 |
| 11 |
|
6 | 8 | 1 | 3 | 4 | 5 | 13 | -8 |
| 12 |
|
5 | 6 | 1 | 2 | 3 | 8 | 11 | -3 |
| 13 |
|
5 | 6 | 1 | 2 | 3 | 7 | 12 | -5 |
| 14 |
|
4 | 8 | 1 | 1 | 6 | 8 | 17 | -9 |
| 15 |
|
3 | 8 | 0 | 3 | 5 | 10 | 25 | -15 |
| # | Squadra | Pnt | G | V | P | S | GF | GS | DIFF |
|---|---|---|---|---|---|---|---|---|---|
| 1 |
|
27 | 14 | 8 | 3 | 3 | 19 | 6 | 13 |
| 2 |
|
27 | 15 | 7 | 6 | 2 | 16 | 7 | 9 |
| 3 |
|
25 | 14 | 6 | 7 | 1 | 16 | 8 | 8 |
| 4 |
|
24 | 15 | 7 | 3 | 5 | 15 | 16 | -1 |
| 5 |
|
22 | 15 | 5 | 7 | 3 | 10 | 8 | 2 |
| 6 |
|
19 | 15 | 5 | 4 | 6 | 11 | 12 | -1 |
| 7 |
|
19 | 15 | 4 | 7 | 4 | 11 | 10 | 1 |
| 8 |
|
19 | 14 | 4 | 7 | 3 | 5 | 5 | 0 |
| 9 |
|
18 | 15 | 4 | 6 | 5 | 16 | 15 | 1 |
| 10 |
|
18 | 13 | 4 | 6 | 3 | 8 | 6 | 2 |
| 11 |
|
16 | 15 | 3 | 7 | 5 | 9 | 7 | 2 |
| 12 |
|
16 | 14 | 3 | 7 | 4 | 7 | 10 | -3 |
| 13 |
|
15 | 14 | 4 | 3 | 7 | 14 | 17 | -3 |
| 14 |
|
14 | 15 | 3 | 5 | 7 | 7 | 14 | -7 |
| 15 |
|
9 | 14 | 2 | 3 | 9 | 6 | 19 | -13 |