


Classifica
| # | Squadra | Pnt | G | V | P | S | |
|---|---|---|---|---|---|---|---|
| 6 |
 Philadelphia |
47 | 33 | 13 | 8 | 12 | |
| 12 |
 Toronto |
39 | 33 | 9 | 12 | 12 |
Il seguito dopo la pubblicità
Il seguito dopo la pubblicità
Serie in corso
S
P
S
P
V
S
V
S
V
P
Ultimi confronti
23/04/26
Toronto
3
Philadelphia
3
10/08/25
Philadelphia
1
Toronto
1
29/05/25
Toronto
1
Philadelphia
2
14/07/24
Toronto
2
Philadelphia
1
30/05/24
Philadelphia
0
Toronto
0
Arbitri
-
Timothy Ford arbitro principale3.50.2Media di cartellini a partita su 16 partite arbitrate
- Tyler Wyrostek assistente
- Chris Penso quarto uomo
- Kevin Terry Jr. arbitro assistente VAR
- Robert Schaap arbitro VAR
- Ian McKay assistente
Il seguito dopo la pubblicità
Il seguito dopo la pubblicità
Giocatori infortunati


Luogo della partita
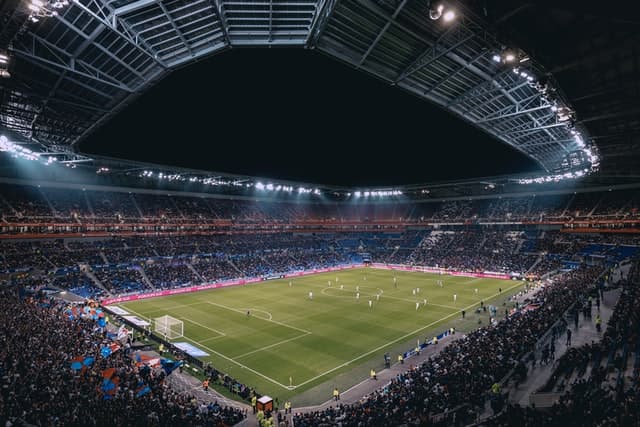
Subaru Park - Chester, Pennsylvania
- Anno di costruzione: 2010
- Superficie: erba
- Capacità: 19778
- Affluenza media: 17545
- Affluenza massima: 19778
- Affluenza minima: 5000
- % di affluenza: 88
Partita in diretta Philadelphia Toronto
- Data 07 novembre 2026 22:00
- Competizione MLS
- Stagione 2026
- Fase Stagione regolare
- Codice PHI-TOR
- Zona Stati-uniti
- Squadra di casa Philadelphia Union
- Squadra in trasferta Toronto
FAQ
Chi è l'arbitro di Philadelphia Toronto ?
Timothy Ford arbitra questo incontro
Dove ha luogo la partita Philadelphia Toronto ?
La partita è allo stadio Subaru Park a Chester, Pennsylvania
Data e ora della partita Philadelphia Toronto ?
Partita in diretta su Calcio Risultati il 07 novembre 2026, calcio d'inizio alle 22:00
Il seguito dopo la pubblicità
Il seguito dopo la pubblicità
Stagione regolare - Eastern Conference
Classifica per gruppo
| # | Squadra | Pnt | G | V | P | S | GF | GS | DIFF | |
|---|---|---|---|---|---|---|---|---|---|---|
| 1 |
 Nashville |
74 | 33 | 22 | 8 | 3 | 69 | 25 | 44 | |
| 2 |
 Inter Miami |
59 | 33 | 16 | 11 | 6 | 77 | 56 | 21 | |
| 3 |
 New England |
58 | 33 | 18 | 4 | 11 | 55 | 46 | 9 | |
| 4 |
 Chicago |
55 | 33 | 16 | 7 | 10 | 61 | 50 | 11 | |
| 5 |
 Charlotte |
53 | 33 | 15 | 8 | 10 | 63 | 48 | 15 | |
| 6 |
Philadelphia
|
47 | 33 | 13 | 8 | 12 | 62 | 51 | 11 | |
| 7 |
 Cincinnati |
46 | 33 | 12 | 10 | 11 | 67 | 73 | -6 | |
| 8 |
 Columbus |
44 | 33 | 13 | 5 | 15 | 55 | 49 | 6 | |
| 9 |
 Orlando |
43 | 33 | 12 | 7 | 14 | 62 | 78 | -16 | |
| 10 |
 New York |
39 | 33 | 11 | 6 | 16 | 45 | 62 | -17 | |
| 11 |
 NYCFC |
39 | 33 | 9 | 12 | 12 | 48 | 45 | 3 | |
| 12 |
Toronto
|
39 | 33 | 9 | 12 | 12 | 51 | 63 | -12 | |
| 13 |
 Atlanta United |
33 | 33 | 9 | 6 | 18 | 43 | 57 | -14 | |
| 14 |
 DC United |
33 | 33 | 7 | 12 | 14 | 39 | 60 | -21 | |
| 15 |
 Montreal |
26 | 33 | 6 | 8 | 19 | 37 | 67 | -30 |
| # | Squadra | Pnt | G | V | P | S | GF | GS | DIFF |
|---|---|---|---|---|---|---|---|---|---|
| 1 |
Nashville
|
47 | 17 | 15 | 2 | 0 | 48 | 14 | 34 |
| 2 |
New England
|
35 | 17 | 11 | 2 | 4 | 31 | 20 | 11 |
| 3 |
Charlotte
|
34 | 17 | 10 | 4 | 3 | 37 | 16 | 21 |
| 4 |
Orlando
|
30 | 16 | 9 | 3 | 4 | 32 | 22 | 10 |
| 5 |
Cincinnati
|
30 | 16 | 9 | 3 | 4 | 39 | 30 | 9 |
| 6 |
Columbus
|
29 | 17 | 9 | 2 | 6 | 29 | 19 | 10 |
| 7 |
Chicago
|
29 | 16 | 9 | 2 | 5 | 30 | 21 | 9 |
| 8 |
Toronto
|
27 | 17 | 6 | 9 | 2 | 36 | 33 | 3 |
| 9 |
Philadelphia
|
26 | 16 | 7 | 5 | 4 | 28 | 18 | 10 |
| 10 |
Inter Miami
|
26 | 16 | 6 | 8 | 2 | 43 | 28 | 15 |
| 11 |
New York
|
21 | 16 | 6 | 3 | 7 | 24 | 29 | -5 |
| 12 |
NYCFC
|
21 | 17 | 5 | 6 | 6 | 30 | 24 | 6 |
| 13 |
DC United
|
20 | 16 | 5 | 5 | 6 | 20 | 28 | -8 |
| 14 |
Atlanta United
|
17 | 17 | 5 | 2 | 10 | 26 | 33 | -7 |
| 15 |
Montreal
|
17 | 16 | 4 | 5 | 7 | 19 | 23 | -4 |
| # | Squadra | Pnt | G | V | P | S | GF | GS | DIFF |
|---|---|---|---|---|---|---|---|---|---|
| 1 |
Inter Miami
|
33 | 17 | 10 | 3 | 4 | 34 | 28 | 6 |
| 2 |
Nashville
|
27 | 16 | 7 | 6 | 3 | 21 | 11 | 10 |
| 3 |
Chicago
|
26 | 17 | 7 | 5 | 5 | 31 | 29 | 2 |
| 4 |
New England
|
23 | 16 | 7 | 2 | 7 | 24 | 26 | -2 |
| 5 |
Philadelphia
|
21 | 17 | 6 | 3 | 8 | 34 | 33 | 1 |
| 6 |
Charlotte
|
19 | 16 | 5 | 4 | 7 | 26 | 32 | -6 |
| 7 |
New York
|
18 | 17 | 5 | 3 | 9 | 21 | 33 | -12 |
| 8 |
NYCFC
|
18 | 16 | 4 | 6 | 6 | 18 | 21 | -3 |
| 9 |
Atlanta United
|
16 | 16 | 4 | 4 | 8 | 17 | 24 | -7 |
| 10 |
Cincinnati
|
16 | 17 | 3 | 7 | 7 | 28 | 43 | -15 |
| 11 |
Columbus
|
15 | 16 | 4 | 3 | 9 | 26 | 30 | -4 |
| 12 |
Orlando
|
13 | 17 | 3 | 4 | 10 | 30 | 56 | -26 |
| 13 |
DC United
|
13 | 17 | 2 | 7 | 8 | 19 | 32 | -13 |
| 14 |
Toronto
|
12 | 16 | 3 | 3 | 10 | 15 | 30 | -15 |
| 15 |
Montreal
|
9 | 17 | 2 | 3 | 12 | 18 | 44 | -26 |
| # | Squadra | Pnt | G | V | P | S | GF | GS | DIFF |
|---|---|---|---|---|---|---|---|---|---|
| 1 |
Nashville
|
62 | 33 | 16 | 14 | 3 | 31 | 11 | 20 |
| 2 |
Inter Miami
|
53 | 33 | 12 | 17 | 4 | 36 | 23 | 13 |
| 3 |
Columbus
|
51 | 33 | 14 | 9 | 10 | 29 | 23 | 6 |
| 4 |
NYCFC
|
51 | 33 | 13 | 12 | 8 | 28 | 19 | 9 |
| 5 |
Charlotte
|
51 | 33 | 13 | 12 | 8 | 26 | 22 | 4 |
| 6 |
New England
|
49 | 33 | 14 | 7 | 12 | 24 | 23 | 1 |
| 7 |
Chicago
|
48 | 33 | 12 | 12 | 9 | 25 | 23 | 2 |
| 8 |
Orlando
|
43 | 33 | 12 | 7 | 14 | 25 | 34 | -9 |
| 9 |
New York
|
42 | 33 | 11 | 9 | 13 | 22 | 24 | -2 |
| 10 |
DC United
|
40 | 33 | 10 | 10 | 13 | 18 | 24 | -6 |
| 11 |
Atlanta United
|
40 | 33 | 9 | 13 | 11 | 18 | 21 | -3 |
| 12 |
Philadelphia
|
37 | 33 | 9 | 10 | 14 | 19 | 27 | -8 |
| 13 |
Montreal
|
36 | 33 | 8 | 12 | 13 | 19 | 25 | -6 |
| 14 |
Cincinnati
|
35 | 33 | 7 | 14 | 12 | 27 | 32 | -5 |
| 15 |
Toronto
|
24 | 33 | 4 | 12 | 17 | 13 | 30 | -17 |
Il seguito dopo la pubblicità
Il seguito dopo la pubblicità
Cronologia confrontazioni
Tutti i confronti
27%
7 vittorie
23%
6 Pareggi
50%
13 vittorie
Ultimi confronti
Tutte le partite
23/04/26
Toronto
3
Philadelphia
3
10/08/25
Philadelphia
1
Toronto
1
29/05/25
Toronto
1
Philadelphia
2
14/07/24
Toronto
2
Philadelphia
1
30/05/24
Philadelphia
0
Toronto
0
Stat dei gol sulle 26 confrontazioni
Tutte le stat
19%
(5)
Nessun gol segnato
(5)
19%
81%
(21)
Almeno 1 gol segnato
(21)
81%
35%
(9)
Più di 1,5 gol segnati
(16)
62%
19%
(5)
Più di 2,5 gol segnati
(8)
31%
12%
(3)
Più di 3,5 gol segnati
(0)
0%
4%
(1)
Più di 4,5 gol segnati
(0)
0%
Gol per periodo su 26 confronti
Più stat
0-15 Min.
6
2
16-30 Min.
6
8
31-45+ Min.
9
6
46-60 Min.
4
7
61-75 Min.
8
12
76-90+ Min.
5
10
Serie in corso
Tutte le partite
S
P
S
P
V
S
V
S
V
P
Ultime partite
Tutte le partite
31/10/26
Cincinnati
1
Philadelphia
0
29/10/26
Nashville
0
Philadelphia
0
25/10/26
Philadelphia
1
New England
2
17/10/26
Philadelphia
2
Charlotte
2
15/10/26
Chicago
1
Philadelphia
3
01/11/26
Atlanta United
3
Toronto
1
29/10/26
Toronto
2
DC United
1
24/10/26
Columbus
4
Toronto
2
18/10/26
New York
0
Toronto
2
15/10/26
Toronto
3
Orlando
3
Stat in MLS
Tutte le stat
62
Gol
51
51
Gol concessi
63
4
Rigori concessi dalla squadra
5
7
Nessun gol subito
4
46%
Possesso
45%
76%
Precisione dei passaggi
81%